Key Stats
→
The Key Stats page provides real-time statistics of various areas of site performance, such as receipt totals, number of voids, and average check amount.
The Key Stats page includes up to seven (7) Key Stats.
Compare Key Stat values from different points in time, such as today's receipt totals compared to yesterday.
Tap a Key Stat value to "drill down" and view a detailed breakdown of its data.
Toggle Expand All/Collapse All to expand/collapse all panels on the current drill down level.
To refresh the Key Stat values to reflect real-time, swipe the screen down.
Note
Time is displayed in 24-hour military format. For example, 3:15:00 PM is displayed as 15:15:00.
Select Sites
→
By default, the Key Stats reflect the combined value for all sites. To view Key Stat values for one or more specific sites:
From the upper-right of the screen, select the site filter icon to open the Select Sites screen.
From the Select Sites window, select the site(s).
From the upper-right of the screen, select the check mark to apply the changes and return to the previous screen.
Note
The Last Online field indicates the date/time when the site last sent data to Mobile Manager. Time is expressed in military (24-hour) format.
Key Stat Comparison Values
→
Change the Key Stat Comparison values to view and compare Key Stats from different dates/time ranges or stores. When the values are changed, the listed Key Stat values are updated automatically.
To compare Key Stat values by date:
From the right of the filter icon in the upper-right of the screen, select the comparison mode icon.
From the Select Comparison Mode popup, toggle Date/Store OFF (default value).
From the Select Comparison Mode popup, select Apply.
Beneath the Key Stat Date Comparison heading, locate the Look At and Compared With fields.
Select the Look At heading.
From the Date Selection menu, select the desired date/period.
To select a specific date or a range of dates, select Custom to select the date(s) from a calendar.
From the upper-right of the Date Selection menu, select the check mark to return to the previous screen.
Select the Compared With heading.
From the Date Selection menu, select the desired date/period.
Note
Same Day Last Year - Compares the current day or yesterday's values with the same date from the previous year.
Same Weekday Last Year - Compares the current day or yesterday's values with the same weekday from the previous year
From the upper-right of the Date Selection menu, select the check mark to return to the previous screen.
To compare Key Stat values by store:
From the right of the filter icon in the upper-right of the screen, select the comparison mode icon.
From the Select Comparison Mode popup, toggle Date/Store ON.
From the Select Comparison Mode popup, select Apply.
Beneath the Key Stat Store Comparison heading, locate the Look At and Compared With fields.
Select the Look At heading.
From the Store Selection menu, select the desired store.
Select the Compared With heading.
From the Store Selection menu, select the desired store.
From the upper-right of the Store Selection menu, select the check mark to return to the previous screen.
Sales Total Key Stat
The Sales Total Key Stat is displayed at the top of the Key Stat list:
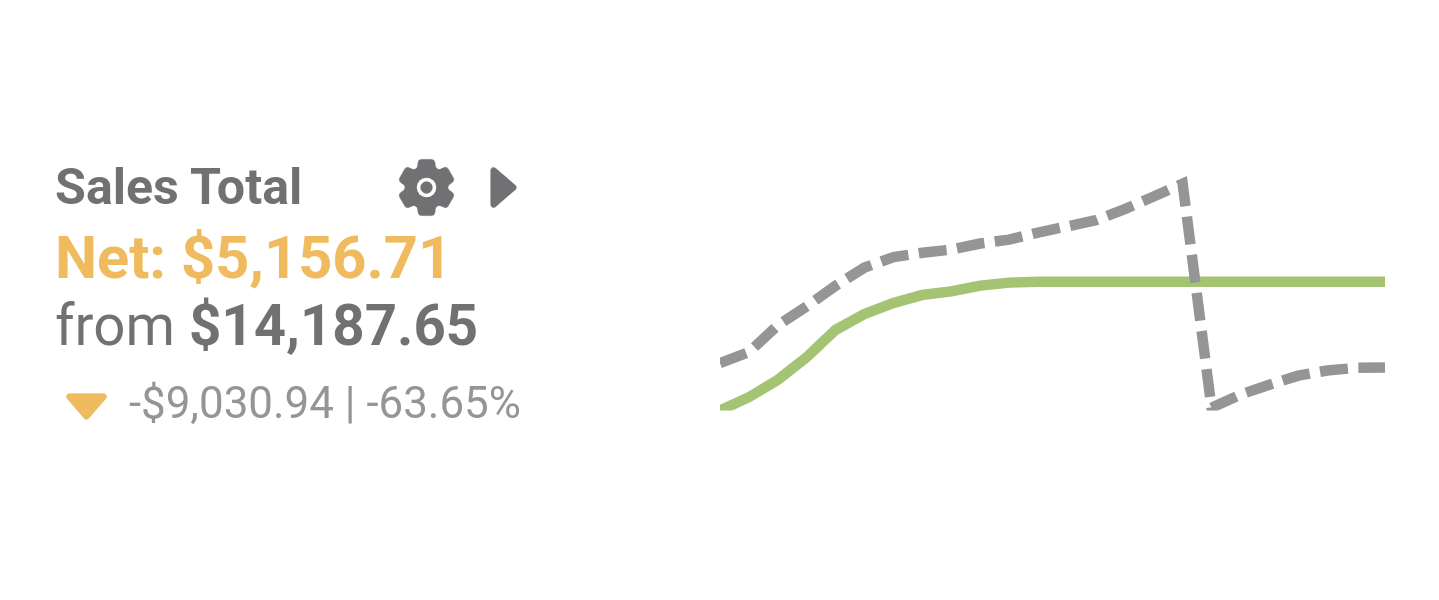 |
The Look At value is displayed first with the Compared With value displayed below it.
The arrow displayed below a Key Stat comparison indicates whether the Look At value is higher  or lower
  than the Compared With value.
Displayed next to the arrow is the monetary difference (or difference in quantity, depending on the Key Stat) between the compared values. This difference is also provided as a percentage.
The Sales Total Key Stat includes a graphical representation of the comparison values.
Sales Total Key Stat Settings
To define settings for the Sales Total Key Stat:
To the right of the Sales Total Key Stat heading, select the cog icon.
From the Settings popup, set the Gross / Net toggle to the desired option:
Gross - View Gross Sales amounts.
Net - View Net Sales amounts.
Select Apply.
Sales Total Key Stat Drill Down
Next to items within a key stat, select the right arrow to "drill down" into the item and view additional information. The following table describes the "drill down" information that is available for the Sales Total key stat.
Key stat name | Open the main page of the Key Stat. | The main page provides the following information:
|
Department or order destination row | Drill down into its total sales. | The second page provides the following information:
|
Item category row | Drill down into its total sales. | The third page provides the following information:
|
Item row | Drill down into the check details. | The fourth page provides the following information about each related check:
|
Check | Select a check from the list to view its details. | The checks are listed in the order in which they were closed. In the upper-right, select the share icon to share the check with other individuals. |