Log Viewer
→ → →
Use Log Viewer to view application log files for troubleshooting purposes. Logs for previous twenty-four (24) hours are listed for all sites by default.
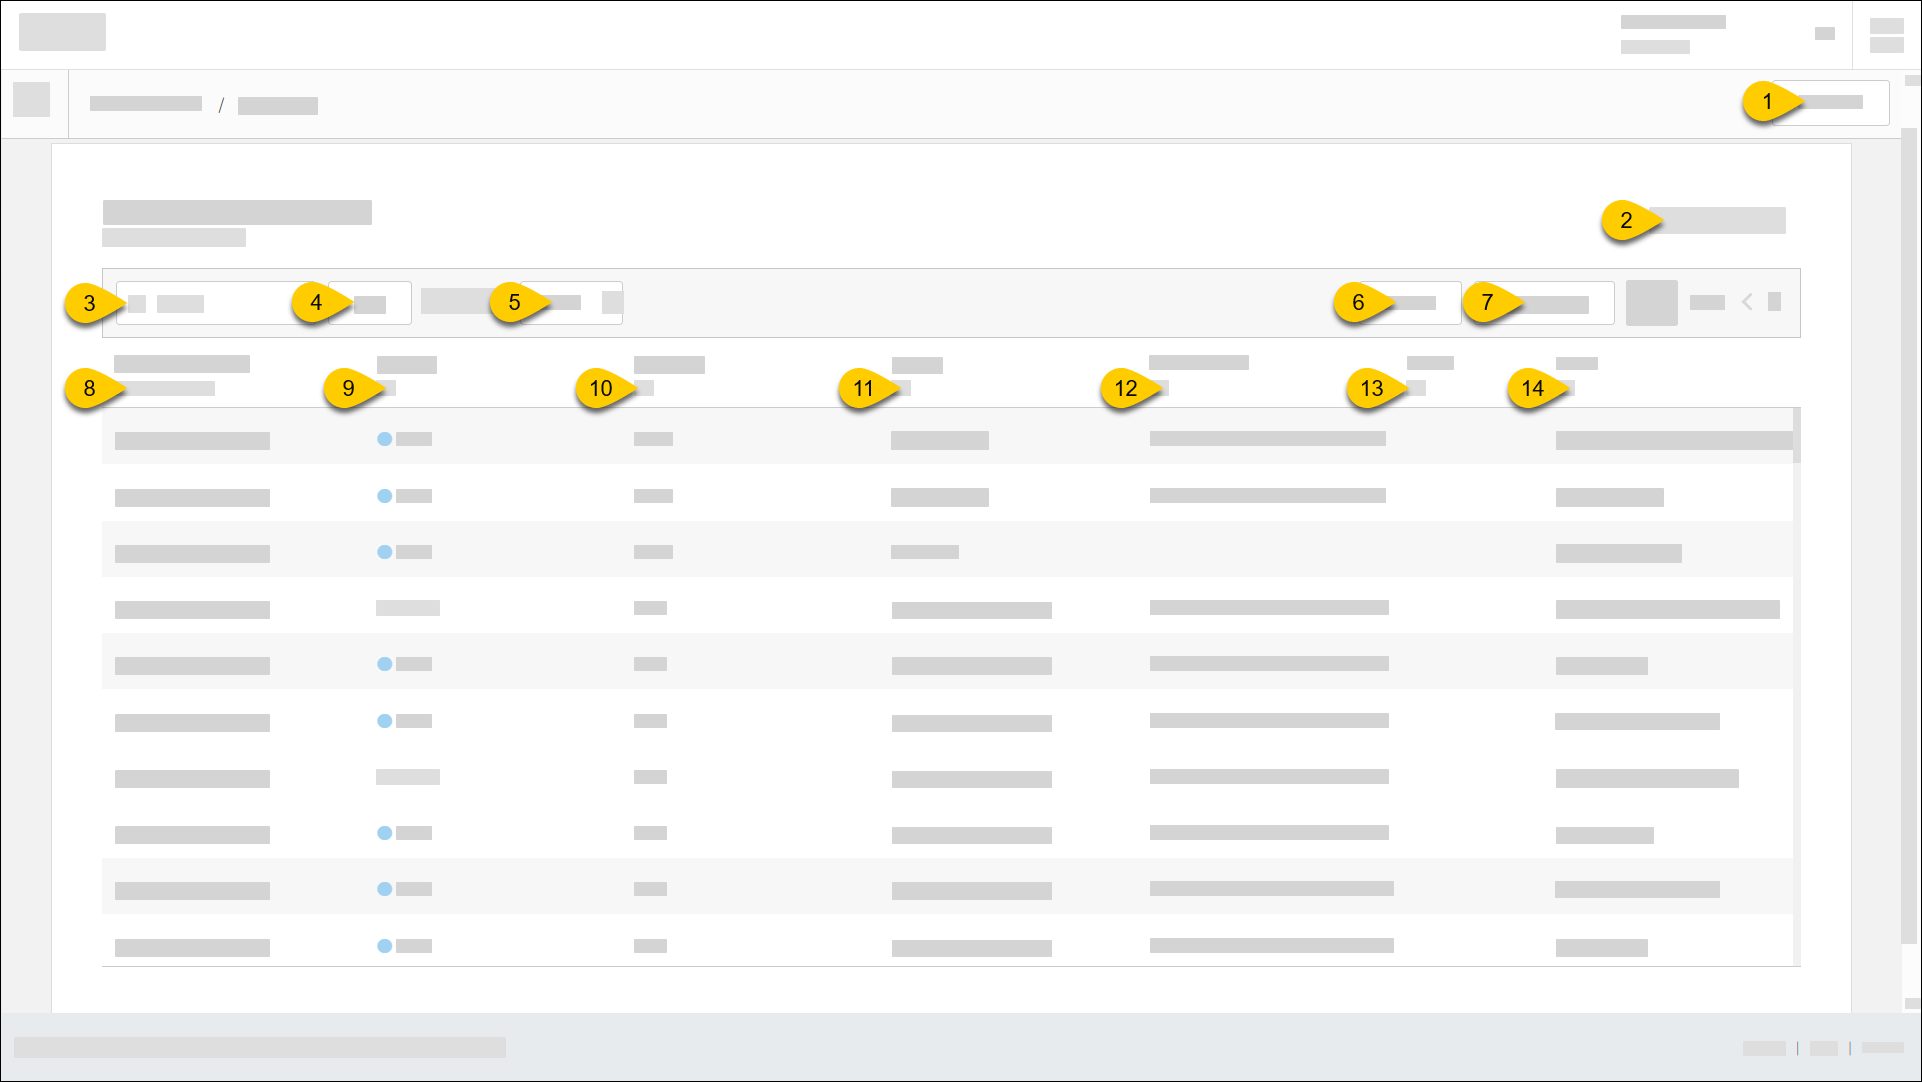 |
1 | All Stores | Select sites to view from Site Selector. When only one (1) site is selected and System Logs is Off, a Terminal Number column is added to the grid. |
2 | System Logs |
|
3 | Search | Type custom search queries to locate specific logs. Define queries in Elasticsearch format. |
4 | Help | View query examples and a list of supported fields. |
5 | Data Source | From the dropdown, select the preferred source for log file data:
|
6 | Refresh | Reload logs in accordance with selected time filters. |
7 | Page Navigation | Use the provided controls to navigate the pages of the log file list. |
8 | Date/Time | Date/time log was created. All timestamps are UTC. See Filter Logs by Date/Time. |
9 | Severity | Indicates severity level of log file. Select All to filter logs by severity level. |
10 | App Code | Identifies the related application. Select All to filter logs by application. If you do not see the preferred app code, select the pencil icon and type the code in the provided field. |
11 | Logger | Identifies the logger (e.g. Data Management API). Select All to filter logs by this attribute. |
12 | Correlation ID | Identifies the context_correlation_ID attribute value. Select All to filter logs by this attribute. |
13 | Site ID | Identifies the related site. Select All to filter logs by site. |
14 | Event | Identifies the related event name/message. Select All to filter logs by event. |
Filter Logs by Date/Time
To filter logs by date/time:
From the Created at (UTC) column of the logs list, select Past 24 Hours.
From the dropdown on the popup, select the preferred time interval. The date/time fields on the popup are automatically updated.
Select Apply.
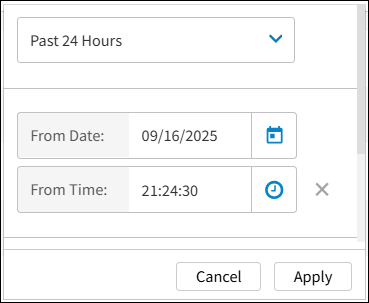
To define a custom time interval:
From the Created at (UTC) column of the logs list, select Past 24 Hours.
From the dropdown on the popup, select Custom.
Specify the From Date/Time.
Specify the To Date/Time.
Select Apply.
View Log Details
From the logs list, select a log to open Log Details.
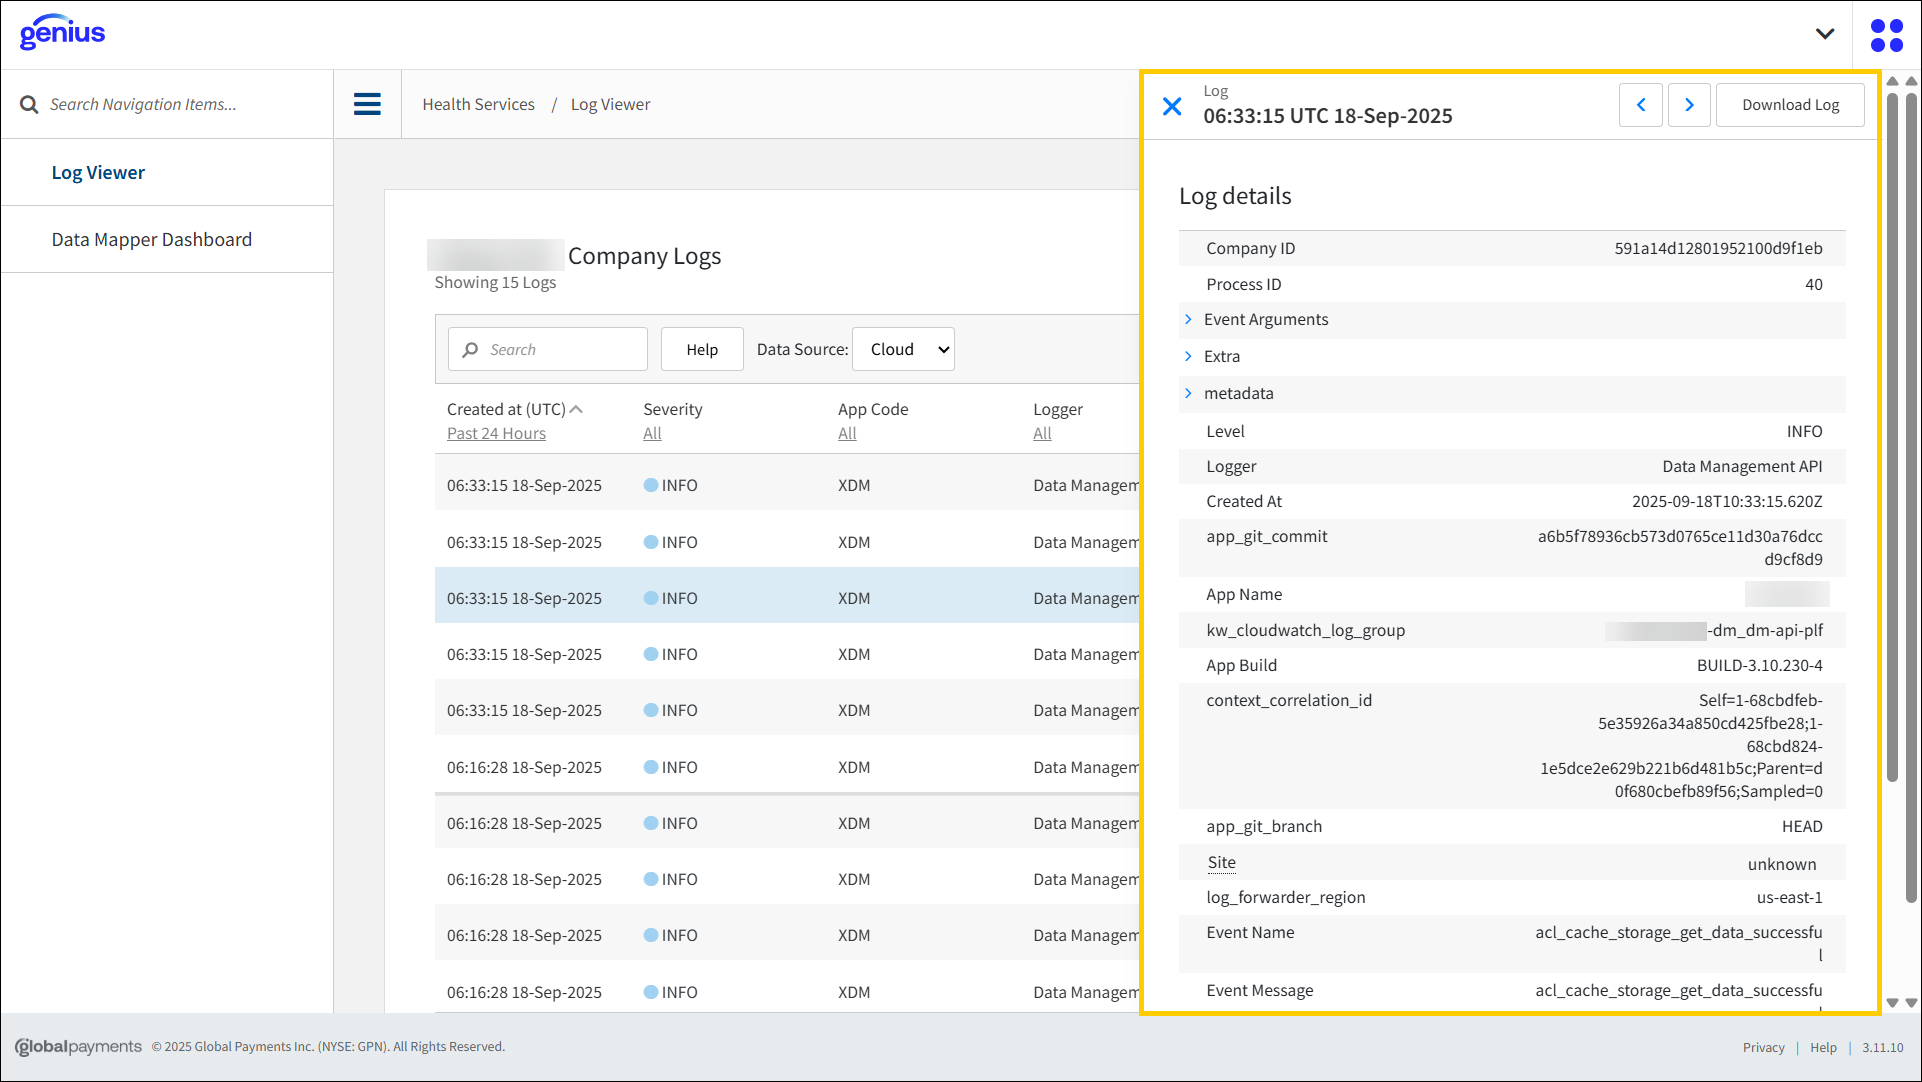 |
Expand Event Arguments to view JSON parameters.
Expand Metadata to view information about the API data.
Hover cursor over Site to view the site name/ID.
Hover cursor over Terminal to view the terminal name/ID (if applicable).
Hover cursor over Order to view the order ID (if applicable).
Download Log
To download the JSON file:
From the logs list, select a log to open Log Details.
From the upper-right of Log Details, select Download Log.
Configure Log Viewer
To configure Log Viewer, see Health Services in Company/Site Preferences in Data Management.